BMDExpress was created for the purpose of providing an easy workflow to transform toxicogenomic data into BenchMark Doses for aggregated collections of genes; KEGG pathways, GO terms, or user defined categories. The end results are parameterized curve fits of dose-response data for individual gene probes together with associated statistics, and a set of intuitive visualizations that simplify drilling into analysis results to yield an improved understanding of the biological response.
Productivity features include interactive, graphical, and dynamic visualizations that enable the user to view and quickly interpret analysis results. On-the-fly filtering enables quick application of constraints, yielding visualizations that zero in on the most important subsets of analysis results. Simultaneous visualization of multiple experiments provides for easy comparison of different chemical treatment conditions within the application interface.
BMDExpress is the product of an ongoing collaboration between the NIEHS Division of the NTP, Health Canada, US EPA, and Sciome LLC, with Sciome primarily responsible for designing and implementing the resulting software.
BMDExpress Application
BMDExpress is a desktop application that enables analysis of dose-response data produced in differential gene expression experiments. It provides a stepwise workflow that combines benchmark dose (BMD) calculation with functional classification analyses based on Gene Ontology (GO), Signaling Pathways (Reactome), or custom categories provided by the user. The end results are dose estimates at which various cellular processes are altered, based on an increase in response in expression levels compared to untreated controls.
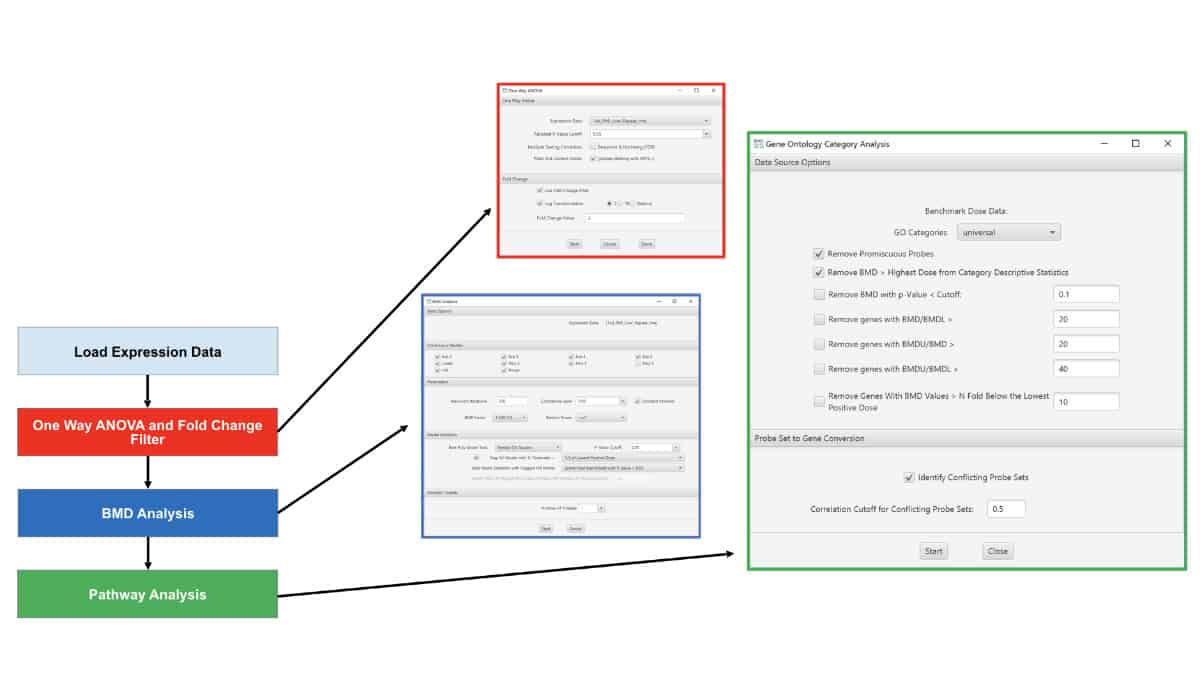
Basic Workflow
Expression data is loaded from a delimited text file, and a microarray platform is chosen. Optionally, one-way ANOVA and/or a fold change filter limits the genes chosen for BMD computation. BMDS analysis is performed on each of the chosen genes, using one or more of the parameterized curve fitting models. Finally, pathway analysis generates benchmark doses for collections of genes in aggregate, revealing thresholds for activation of molecular systems that are affected by chemical treatment.
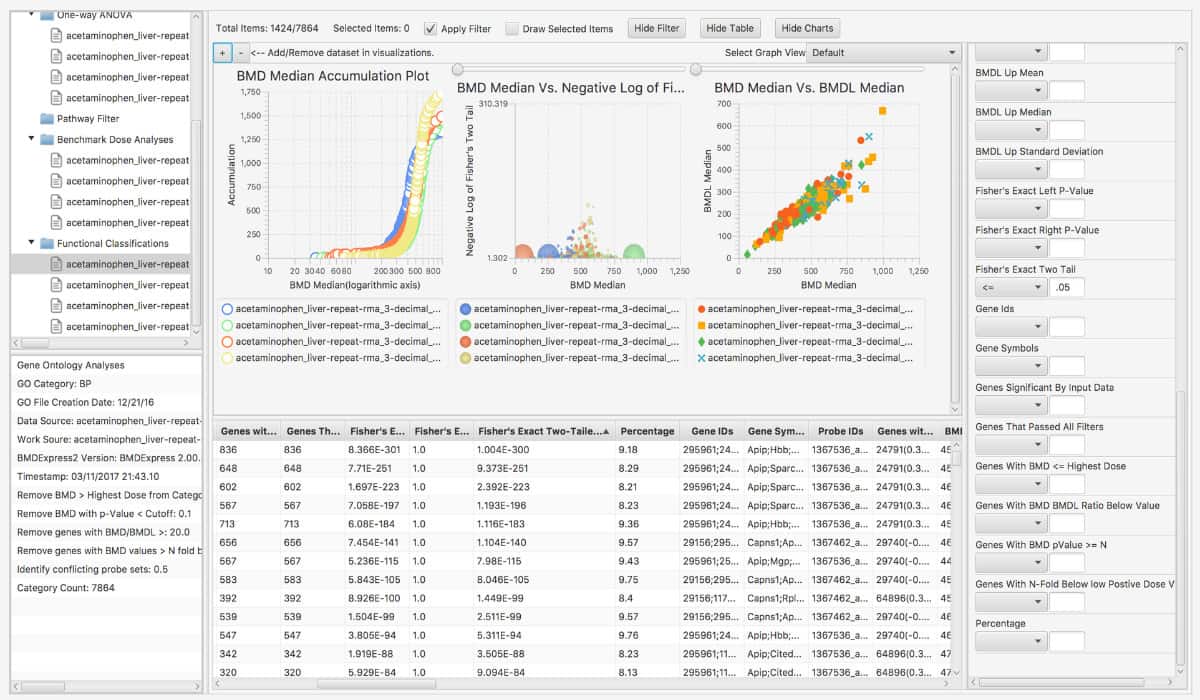
Interactive Visualizations
BMDExpress is a desktop application that enables analysis of dose-response data produced in differential gene expression experiments. It provides a stepwise workflow that combines benchmark dose (BMD) calculation with functional classification analyses based on Gene Ontology (GO), Signaling Pathways (Reactome), or custom categories provided by the user. The end results are dose estimates at which various cellular processes are altered, based on an increase in response in expression levels compared to untreated controls.
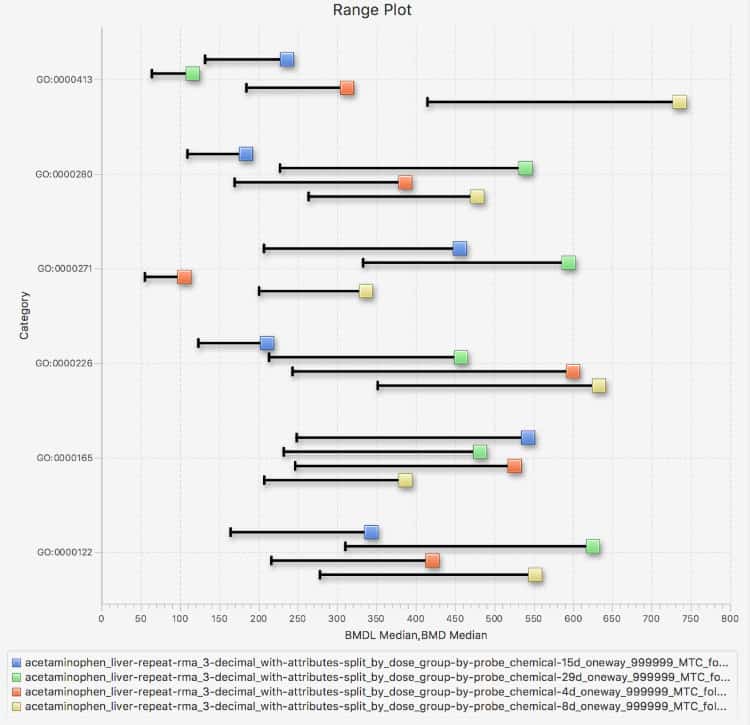
BMD/BMDL RANGE – Visualize the distribution of BMD levels across pathways and functional categories.
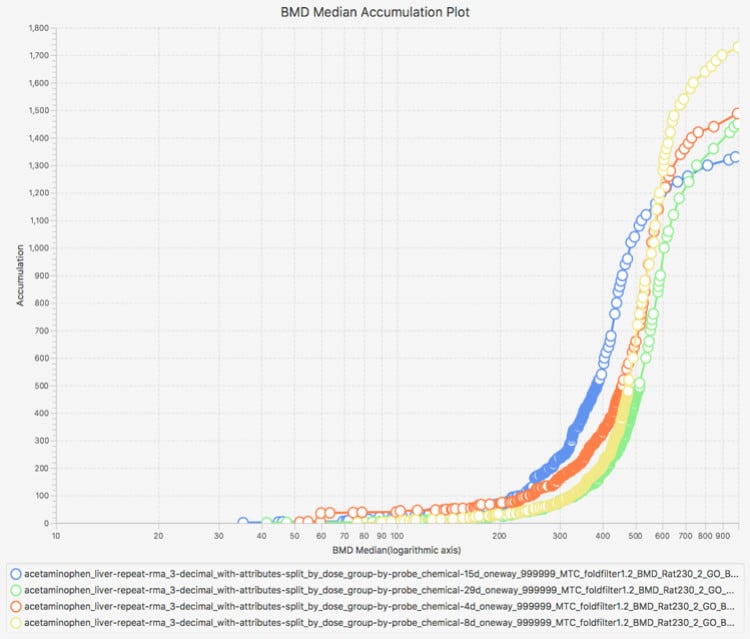
ACCUMULATION PLOT - Accumulation of pathway counts from multiple dose response experiments through the range of pathway BMD Median values.
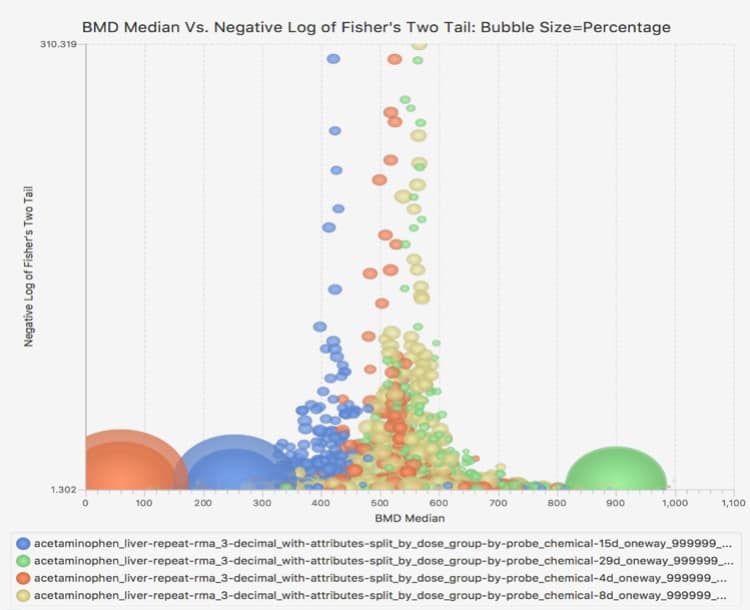
BUBBLE CHART - Find pathways that show significant signal by viewing the Fisher’s Two Tail, BMD Median and Percentage of genes that passed the pathway analysis filters.
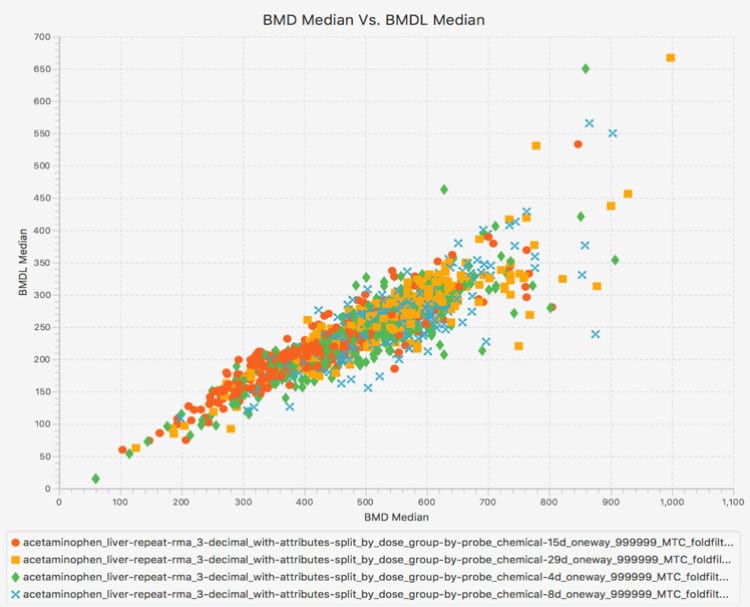
SCATTER PLOT - Compare BMD and BMDL values to get an idea for the dose response range that cause adverse biological effects.
Publications and Presentations
Phillips J.R., Svoboda D.L., Tandon A., Patel S., Sedykh A., Mav D., Kuo B., Yauk C.L., Longlonog Y., Thomas R.S., Gift J.S., Davis J.A., Olszyk L., Merrick B.A., Paules R.S., Parham F.,Saddler T., Shah R.R., and Auerbach S.S.(2019) BMDExpress 2: enhanced transriptomic dose-response analysis workflow. Bioinformatics 35(10): 1780-1782.
A. Sedykh, J. Phillips, D. Svoboda, S. Patel, T. Saddler, S. Ferguson, R. Shah, and S. Auerbach (2018) BMDExpress 2.2: New Features and Enhancements for Toxicogenomic DoseResponse Modeling. Poster presentation at the Society of Toxicology’s 57th Annual Meeting and ToxExpo, San Antonio, TX.
J. Phillips, D. Svoboda, A. Sedykh, A. Tandon, D. Mav, C. Yauk, B. Kuo, R. Shah, S. Auerbach. Bmdexpress 2.0: Toxicogenomic DoseResponse Modeling, Visualization, and Analysis Tool. In: 2017 Annual Meeting Abstract Supplement, Society of Toxicology, 2017. Abstract no. 1829.