The predicted progress graph (which becomes available once you have screened approximately 10% of the total references), shows you the estimated recall so far as a function of the absolute number of documents screened.
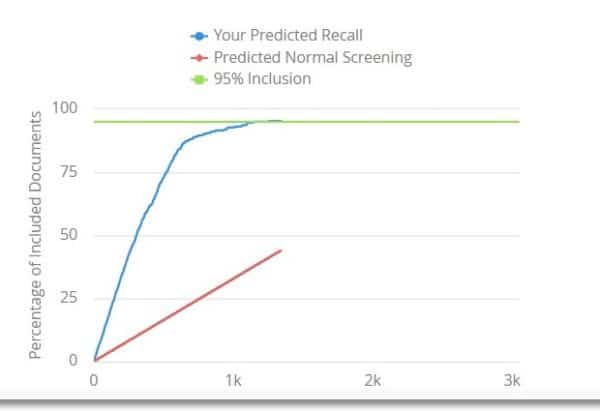
If you were screening in random order, the expected percentage of documents needed to obtain 95% recall would be 95% of the total documents. And to achieve 50% recall, you’d have to screen 50% of the articles. Generally speaking, expected recall in the random ordered scenario recall is simply equal to the percentage of documents screened so far. And that’s represented by the red diagonal line. For the project represented in the graph above, using the prioritized article list, I was able to obtain 95% recall after screening 44% of the total documents rather than 95%.