You’ll see is that at the top, right side of the screen, there is a dropdown that indicates you are “Viewing Project As” [Last Name, First Name]. This indicates you are viewing the project progress of a specific user, and that the results shown pertain to the individual selected from the dropdown menu. For example, you will see that Rebecca Elmore personally screened 1,357 out of 3,574 titles and abstracts in Level 1, and Rebecca screened 479 references as “included” and the other 878 as “excluded.” If you hover over the “Included” and “Excluded” bar charts, you will see the specific number of references represented by each chart. This information is also represented in the pie chart shown on the screen.
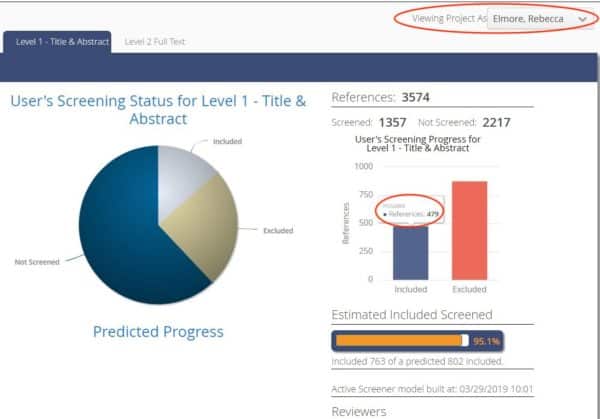
From the same screen, you will see that the machine learning has estimated that overall (among all reviewers), 763 articles have been included. The screen also shows that it is estimated that – in total, there may be as many as 802 included articles in this project; and the estimate recall as a percentage is roughly 95.1%.
Review: What is Included on the Review Summary Screen
- Individual user screening progress
- Overall screening progress
- Predicted Progress Graph
- Note: The Predicted Progress Graph only becomes visible once ~10% of total references have been screened
- Estimated recall percentage
- Tip: This screen can help you decide when to stop screening (when you’ve achieved a sufficient level of recall)